Checklist Financial Analysis: Difference between revisions
| Line 1: | Line 1: | ||
< | <itpmch><title>Checklist Financial Analysis | IT Process Wiki</title> | ||
<meta name="keywords" content="financial analysis itil, itil financial analysis" /> | |||
<meta name="description" content="The Financial Analysis is an important input to the ITIL Portfolio Management process. It contains information on the costs for providing services ..." /> | |||
</itpmch> | |||
<imagemap> | <imagemap> | ||
Image:ITIL-Wiki-de-es.jpg|DE - ES - Checklist Financial Analysis - Template Financial Analysis|100px | Image:ITIL-Wiki-de-es.jpg|DE - ES - Checklist Financial Analysis - Template Financial Analysis|100px | ||
| Line 8: | Line 11: | ||
<br style="clear:both;"/> | <br style="clear:both;"/> | ||
<p> </p> | |||
'''ITIL Process''': [[ITIL | '''ITIL Process''': [[ITIL Service Strategy|ITIL 2011 Service Strategy]] - [[Financial Management]] | ||
'''Checklist Category:''' [[ITIL-Checklists# | '''Checklist Category:''' [[ITIL-Checklists#ITIL 2011 Templates|Templates ITIL 2011]] - Service Strategy | ||
'''Source''': Checklist "Financial Analysis" from the [https://en.it-processmaps.com/products/itil-process-map.html ITIL Process Map] | '''Source''': Checklist "Financial Analysis" from the [https://en.it-processmaps.com/products/itil-process-map.html ITIL Process Map] | ||
<p> </p> | <p> </p> | ||
===<span id="Financial Analysis ITIL">Overview</span>=== | |||
[[image:Financial-analysis-itil.jpg|frame|right|alt=ITIL Financial Analysis|Fig. 1: [[Checklist Financial Analysis|ITIL Financial Analysis]] - Definition and information flow.]] | |||
The ''Financial Analysis'' is an important input to the [[Service Portfolio Management]] process. It contains information on the costs for providing services and provides insight into the profitability of services and customers. | The ''Financial Analysis'' is an important input to the [[Service Portfolio Management]] process. It contains information on the costs for providing services and provides insight into the profitability of services and customers. | ||
| Line 29: | Line 36: | ||
<p> </p> | <p> </p> | ||
====Service-focused analysis==== | |||
# Costs for the provisioning of each service, itemized by cost types (e.g. licenses, material, labor) | # Costs for the provisioning of each service, itemized by cost types (e.g. licenses, material, labor) | ||
## Direct costs (clearly attributable to a specific service) | ## Direct costs (clearly attributable to a specific service) | ||
| Line 51: | Line 58: | ||
## What services risk becoming unprofitable because of declining demand? | ## What services risk becoming unprofitable because of declining demand? | ||
====Customer profitability==== | |||
# Actual revenues from each customer | # Actual revenues from each customer | ||
# Profits from each customer | # Profits from each customer | ||
====Asset valuation==== | |||
# Values of tangible service assets (infrastructure components) | # Values of tangible service assets (infrastructure components) | ||
# Estimates of the values of intangible assets (e.g. technical expertise, knowledge of the customers’ business processes) | # Estimates of the values of intangible assets (e.g. technical expertise, knowledge of the customers’ business processes) | ||
====Actual vs. planned spending==== | |||
For all items covered in the IT Budget: | For all items covered in the IT Budget: | ||
# Forecast (planned budget) | # Forecast (planned budget) | ||
| Line 65: | Line 72: | ||
# If applicable, gap analysis | # If applicable, gap analysis | ||
====Funding options==== | |||
Possible savings from leasing/outsourcing technology as opposed to owning it (shifting costs from the CAPEX budget to the OPEX budget). | Possible savings from leasing/outsourcing technology as opposed to owning it (shifting costs from the CAPEX budget to the OPEX budget). | ||
====Post-Program ROI (Return on Investment) Analysis==== | |||
Assessment if financial objectives of past investments have been met. | Assessment if financial objectives of past investments have been met. | ||
# Investment/ project | # Investment/ project | ||
| Line 77: | Line 84: | ||
<p> </p> | <p> </p> | ||
<html><a rel="author" href="https://plus.google.com/111925560448291102517"><img style="margin:0px 0px 0px 0px;" src="/skins/Vector/images/itpm/bookmarking/gplus.png" width="16" height="16" title="By: Stefan Kempter | Profile on Google+" alt="Author: Stefan Kempter, IT Process Maps GbR" /></a></html> | |||
<!-- This page is assigned to the following categories: --> | <!-- This page is assigned to the following categories: --> | ||
Revision as of 15:28, 3 August 2013

ITIL Process: ITIL 2011 Service Strategy - Financial Management
Checklist Category: Templates ITIL 2011 - Service Strategy
Source: Checklist "Financial Analysis" from the ITIL Process Map
Overview
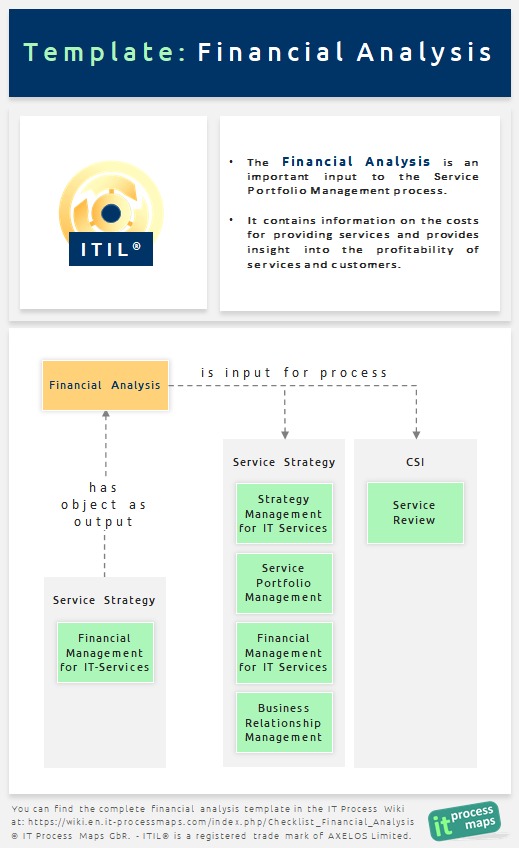
The Financial Analysis is an important input to the Service Portfolio Management process. It contains information on the costs for providing services and provides insight into the profitability of services and customers.
ITIL Financial Analysis - Contents
The Financial Analysis typically contains the following information:
Service-focused analysis
- Costs for the provisioning of each service, itemized by cost types (e.g. licenses, material, labor)
- Direct costs (clearly attributable to a specific service)
- Indirect costs (shared among multiple services)
- Trends in the provisioning costs for services
- Variable cost dynamics
- Estimates of how costs will change in the case of
- Increasing service demand
- Decreasing service demand
- Thresholds of service demand which require the service provider to make significant investments
- Estimates of how costs will change in the case of
- Service Value Potential (estimate of the price a customer is prepared to pay for the services)
- Competing alternatives and their prices
- Value of the service provider’s comparative advantages (e.g. unique knowledge of the customers’ business processes, security concerns)
- Costs for switching to competing service offerings
- Profitability
- Actual revenues from each service
- Profit margins for each service
- Identification of financially unviable services
- What services are no longer provided efficiently relative to competing offers
- What services are provided to customers at a financial loss?
- What services risk becoming unprofitable because of declining demand?
Customer profitability
- Actual revenues from each customer
- Profits from each customer
Asset valuation
- Values of tangible service assets (infrastructure components)
- Estimates of the values of intangible assets (e.g. technical expertise, knowledge of the customers’ business processes)
Actual vs. planned spending
For all items covered in the IT Budget:
- Forecast (planned budget)
- Actual spending on record
- If applicable, gap analysis
Funding options
Possible savings from leasing/outsourcing technology as opposed to owning it (shifting costs from the CAPEX budget to the OPEX budget).
Post-Program ROI (Return on Investment) Analysis
Assessment if financial objectives of past investments have been met.
- Investment/ project
- Business case
- Budget spent
- Expected benefits
- Realized benefits
